
I present you Unicorn Dependency Graph Generator. It will give you a bit more information about your unicorn configurations and solve problems with missing dependencies.
Introduction
Have you ever encountered errors during Unicorn deserialization caused be a missing dependency between project A and project B?
It happened to me too many times, so I decided to solve that problem with technology.
Unicorn Dependency Graph Generator is a script written in PowerShell.
This post describes it’s features and how to use it.
Features
With graph generator script you can generate graphs or export raw data and use it later for fixing configuration problems.
Graph:
- config based dependency graph - dependencies will be taken from current configuration files. This mode simply reflects current state of your unicorn configurations,
- computed dependency graph - dependencies will be determined from Sitecore content (id/path dependencies). This mode generates correct Unicorn dependencies configuration,
- mixed dependency graph - mixed or diff graph will present differences between first and second graph. You can see which of current configuration dependencies are redundant or missing
General:
- generate list view with desired configuration - you are able to export results to (
.json,.html,.xml,.csv,.xls), so you can use it for fixing your current configuration issues
How to get it
You can find whole code here: UnicornDependencyGraphGenerator.ps1
How to use
Open Sitecore Powershell ISE and paste the code.
Once you execute the script you will see following dialog.
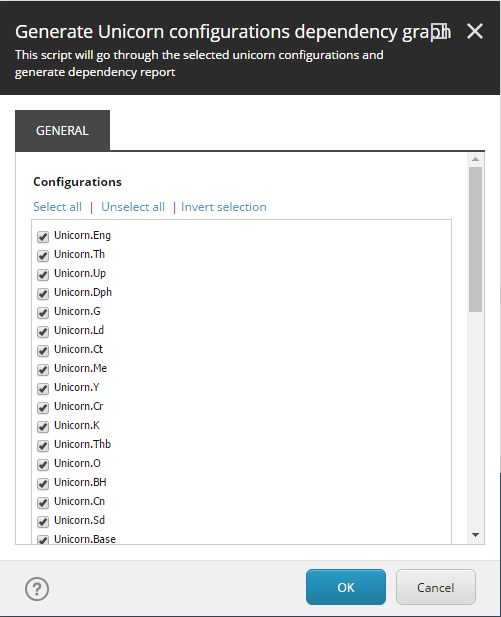
You can select which Unicorn configurations should be analysed (by default all are selected). This option was added just in case you want to analyse only selected configurations.
Once you click Ok, the script will generate dependencies objects. It may take a while, depending how many configurations you’ve selected.
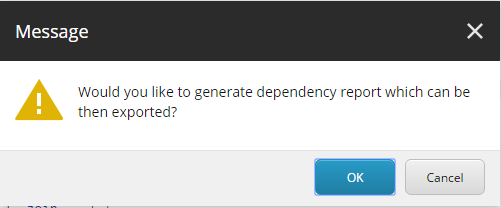
Next, you will be asked whether the script should generate a list view with desired dependencies.
Once you opt-in you will see the following window opened in the background.
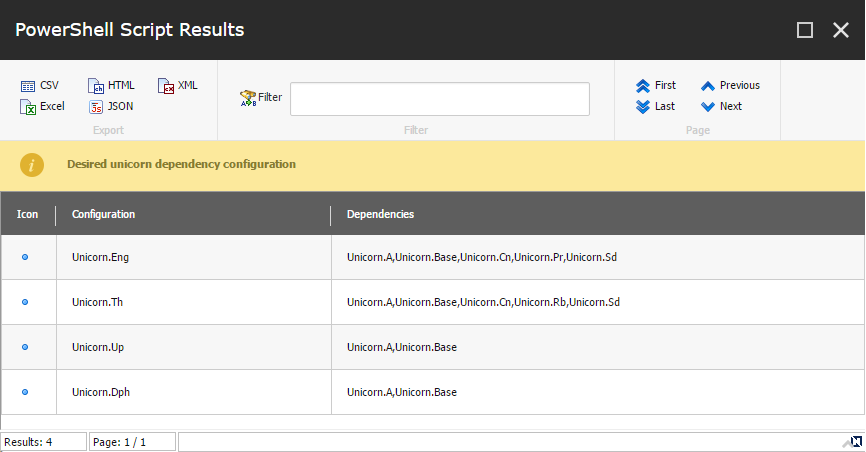
Like mentioned earlier. You are able to export correct dependencies report.
Next, you will see the final dialog with an option to select which type of dependency graph should be shown.
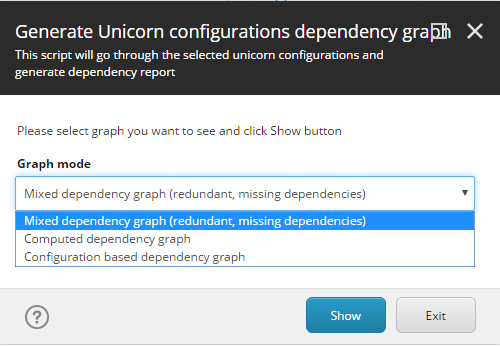
On the pictures below you can see the examples of each graph type.
The most interesting and probably the most often used one is the first one (mixed). It shows missing and redundant dependencies for your current configuration.
Mixed Dependency Graph
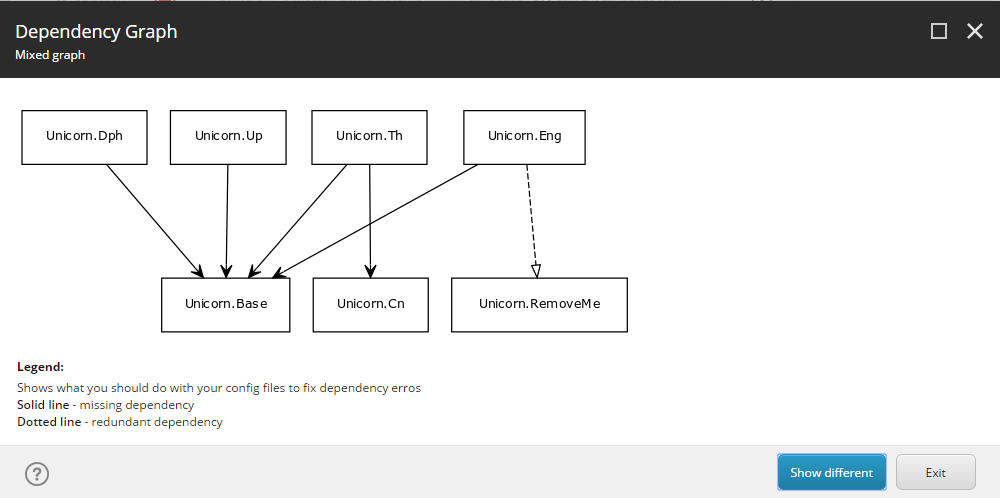
Unicorn.Dphis missingUnicorn.BasedependencyUnicorn.Upis missingUnicorn.BasedependencyUnicorn.This missingUnicorn.BasedependencyUnicorn.This missingUnicorn.CndependencyUnicorn.Engis missingUnicorn.BasedependencyUnicorn.Enghas redundant dependency (Unicorn.RemoveMe)
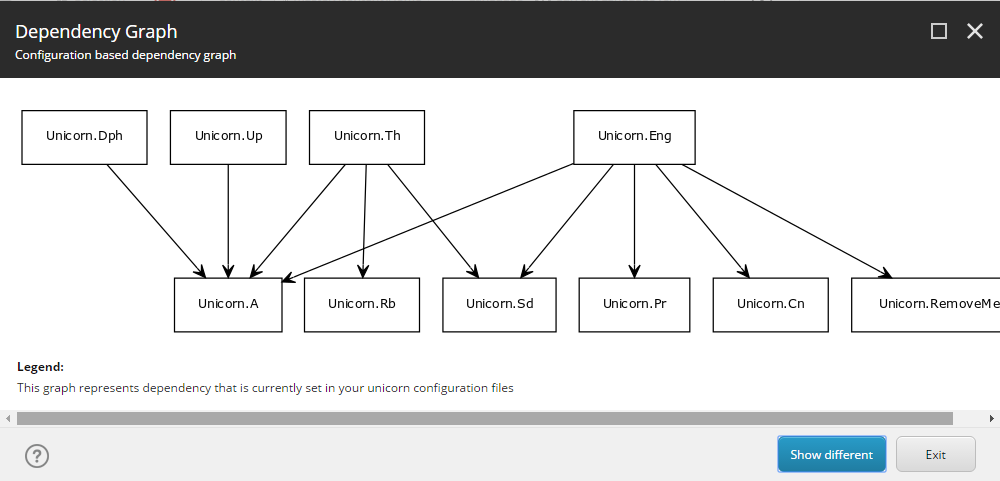
Configuration based Dependency Graph
Notice dependency: Unicorn.RemoveMe. In first graph, it is marked as redundant. This graph presents config based graph so it is present.
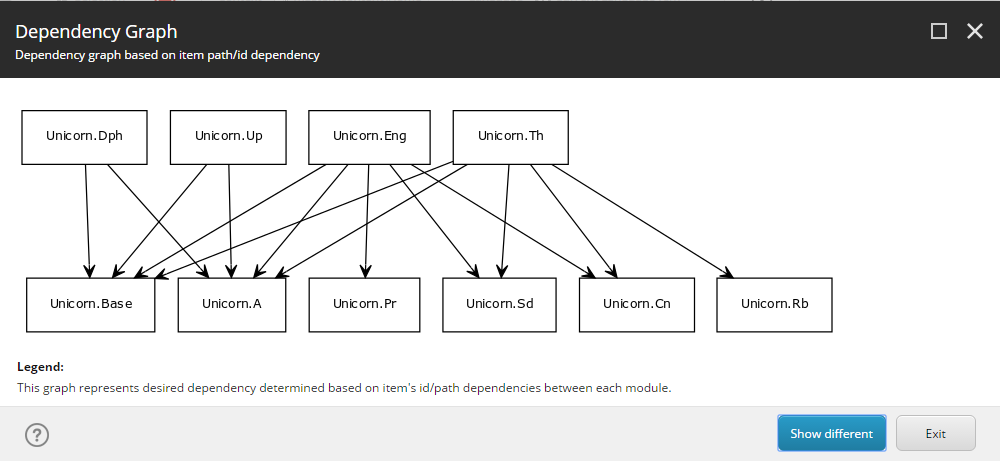
Computed Dependency Graph
This is a graph with correct dependencies. After you fix all issues reported in Mixed/Diff graph your dependency configuration will look like this.
Summary
Graphs are generated thanks to this page: https://yuml.me/.
If for any reason you want to avoid submitting unicorn configuration names to external services, you can still use the script to generate a report and skip the step with graph drawing.
Edit: [14 Oct 2024]
Logic has been updated . New method fixes two problems that were discovered:
414error (Request-URI Too Large) - for solutions with multiple configurations, passing data via URL was not a good choice -yuml.melimits the length of incoming URLs;- CSP errors - loading images from other domains was blocked at some point by Sitecore - script will download them to temp folder now.