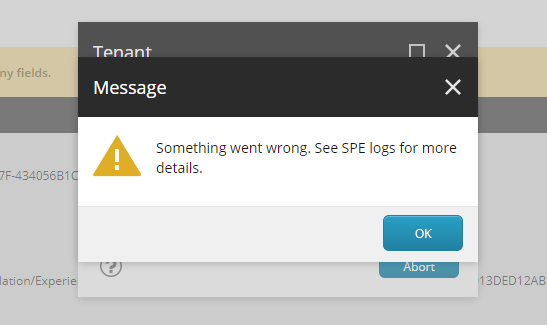
This article describes how to debug SXA Scaffolding.
Introduction
Have you ever encountered problems with SXA scaffolding?
Probably no because it works flawlessly 😎
You might still see it crashing when you try to write your modules and extend scaffolding.
20:51:37 INFO  The script execution in ScriptSession '$scriptSession$|i1wx3djw0xyhw0gtyhbutqyr|38b9487a-d259-400e-a503-7f25c853bc50' completed in 7 ms.
20:51:58 ERROR Cannot bind argument to parameter 'Item' because it is null.
20:51:58 INFO  The script execution in ScriptSession '$scriptSession$|i1wx3djw0xyhw0gtyhbutqyr|3efa12c1-8489-41d1-a1d8-3f2b0f43d4d0' completed in 29170 ms.
As logs are not always a good source of information we have to find the other way.
Based on my experience with Sitecore Powershell Extensions and SXA scaffolding I will share with you how to deal with that.
Debugging
Almost every cmdlet in SXA is a separate item. It makes things hard to debug if code is not in a single place/file (see how to debug in SPE)
Thanks to the fact that all cmdlets written in SXA follow a common scheme we can find out where exactly our logic has failed.
Notice Write-Verbose calls in this example
function Do-AwesomeThing {
    [CmdletBinding()]
    param(..)

    begin {
        Write-Verbose "Cmdlet Do-AwesomeThing - Begin"
    }

    process {
        Write-Verbose "Cmdlet Do-AwesomeThing - Process"
        # Awesome logic
    }

    end {
        Write-Verbose "Cmdlet Do-AwesomeThing - End"
    }
}
Thanks to Write-Verbose we can track how scripts were executed - both the order and nesting.
Debug with Verbose switch
I already recommended this way to many people on the community slack with pretty good results.
All you have to do is to add -Verbose switch to the script that you want to debug.
Let’s assume that you see an error while creating a tenant.
Follow the steps below
- Open ISE
https://sc/sitecore/shell/Applications/PowerShell/PowerShellIse?sc_bw=1 - Find and open a script that you want to debug
/sitecore/system/Modules/PowerShell/Script Library/SXA/SXA - Scaffolding/Content Editor/Insert Item/Tenant
- Remove
try/catchwrappers to let output appear on a console - Add
-Verboseswitch to the cmdlet that fails
$ctx = gi .
Import-Function New-Tenant

$model = Show-NewTenantDialog $ctx
New-Tenant $model -Verbose
Once you run the script you will see an error (if something is broken of course)
As you can see it failed while trying to execute the following action:
/sitecore/system/Settings/Foundation/Experience Accelerator/Multisite/Multisite Tenant Setup/Break
There might be different problems with this script. You probably know better 😄
The thing is that you know where to look to solve the problem.
Debug with call-stack visualizer
This approach is very similar to the previous method but it adds additional PowerShell magic to make things much nicer
The idea here is to wrap code with something like this
$outStream = $( . {
        # CODE TO DEBUG GOES HERE
    } | Out-Null) 2>&1 4>&1

$lines = Convert-FromOutStreamToXML $outStream
Out-Download -Name "log.xml" -InputObject ([string[]]$lines)
Grab the latest version of a script from GitHub: Debug-SxaScaffolding.ps1
As a result, you will get call stack of all scaffolding actions represented as XML
To use this method follow the steps below:
- Open ISE
https://sc/sitecore/shell/Applications/PowerShell/PowerShellIse?sc_bw=1
/sitecore/system/Modules/PowerShell/Script Library/SXA/SXA - Scaffolding/Content Editor/Insert Item/Tenant
- Find and open a script that you want to debug
- Remove
try/catchwrappers to let output appear on a console - Wrap code that you want to debug
$outStream = $( . {
        $ctx = Get-Item .
        Import-Function New-Tenant

        $model = Show-NewTenantDialog $ctx
        New-Tenant $model -ver
    } | Out-Null) 2>&1 4>&1

$lines = Convert-FromOutStreamToXML $outStream
Out-Download -Name "log.xml" -InputObject ([string[]]$lines)
Example output
Error details will be stored in
<cmdlet name="Invoke_TenantAction">
    <process_Invoke_TenantAction />
    <cmdlet name="Get_TenantTemplate">
        <process_Get_TenantTemplate />
    </cmdlet>
    <message value="Invoking Tenant Action: /sitecore/system/Settings/Foundation/Experience Accelerator/Multisite/Multisite Tenant Setup/Break" />
    <cmdlet name="Invoke_ExecuteScript">
        <process_Invoke_ExecuteScript />
        <message value="Executing script: " />
        <message value="Current tenant: /sitecore/content/D/t22" />
        <message value="Tenant templates: {93D18F94-3680-4596-B70B-8AFBFF3CFCE0} {2CE747C9-6961-4560-A96A-4AC008D3DC68} {776A5655-19B7-4C1D-9838-E19621FB2FEB} {EC6F5B8B-A556-4364-8441-61BC1F54CAF0} {5FFB8B43-40F1-46F2-B49E-727FB74CB732} {F543A2D2-5C28-44E3-8C52-3491AAC234F4} {BF5608F4-E886-43FA-865C-FBBEE3543CED} {4BA0DFA4-B03C-418D-98BC-378E9D6B915F} {A80EE8A0-C2BF-4A0C-BE71-232A54368EA1} {6F12ECCB-F3C4-43D9-A415-B6BF29015D60}" />
        <error script="Invoke-ExecuteScript" line="51" char="17">
            <message value="Cannot bind argument to parameter 'Item' because it is null." />
            <line value="Invoke-ExecuteScript $ActionItem  $tenant $tenantTemplates, ," />
        </error>
    </cmdlet>
</cmdlet>
This is only a part of the output. You can see the whole file here
If you will open this file in any text editor you can easily fold unwanted parts and see only what matters to you.
Summary
I hope that no one will ever need it for debugging errors. I wish you all bugless development.
The thing about the script for visualizing call stack is that you can see how every script work, especially complicated ones, with a lot of different cmdlets used inside and multiple levels of nesting.


